Novus Acquisition & Development Corp. (NDEV) up 30x In Last 12 Months, but Volume is Waning
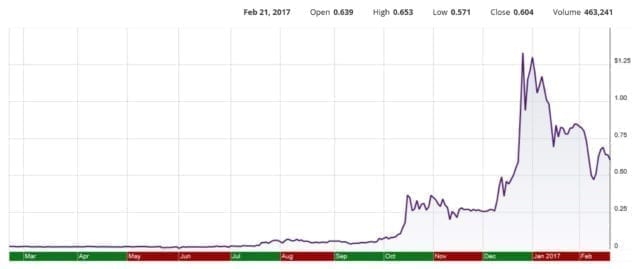
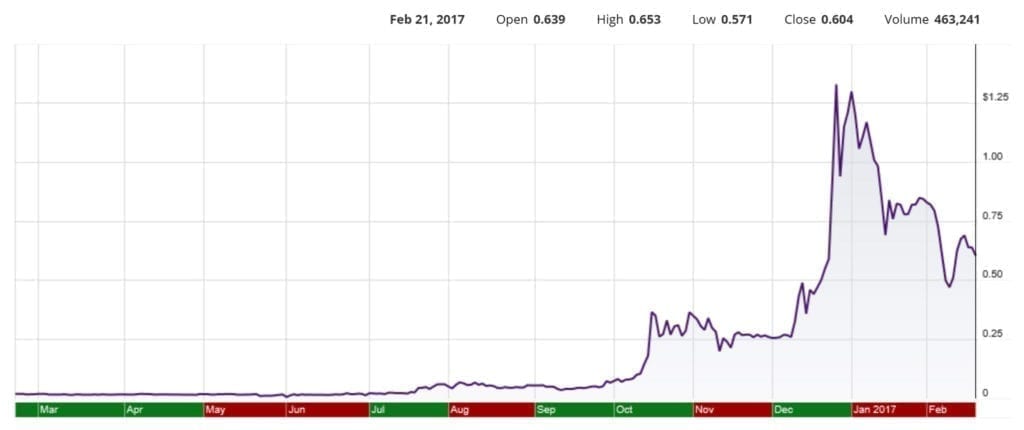
With a 52 week range of 0.02 – 1.51, Novus has been on quite a ride. As of February 20, 2017, this cannabis stock is up over 30 times in the last 12 months, but down about half from where it was at the end of 2016.

Volume overall has waned. It may be that investors chose to sit on the stock, but it could be the recent plunge is due to an orchestrated pump and dump, ever so common in these micro cap stocks. The company currently operates at a loss. However, its market cap of $1.26M is very modest for the marijuana market. In fact, the stock is very heavily traded compared to its low market cap.
Will NDEV take off in the future? Who knows, but some profits being posted, or just plain old hype, may take it ot the next level. What do you think? Let us know in the comments below!
*The above references an opinion and is for information purposes only. It is not intended to be investment advice. Seek a duly licensed professional for investment advice.


